What is a leptokurtic distribution?
What is a leptokurtic distribution?
A leptokurtic distribution is fat-tailed, meaning that there are a lot of outliers.
Leptokurtic distributions are more kurtotic than a normal distribution. They have:
- A kurtosis of more than 3
- An excess kurtosis of more than 0
Leptokurtosis is sometimes called positive kurtosis, since the excess kurtosis is positive.
A trick to remember the meaning of “leptokurtic” is to think of a leaping kangaroo with a fat tail.
Leptokurtic distribution example
Imagine that four astronomers are all trying to measure the distance between the Earth and Nu2 Draconis A, a blue star that’s part of the Draco constellation. Each of the four astronomers measures the distance 100 times, and they put their data together in the same dataset:
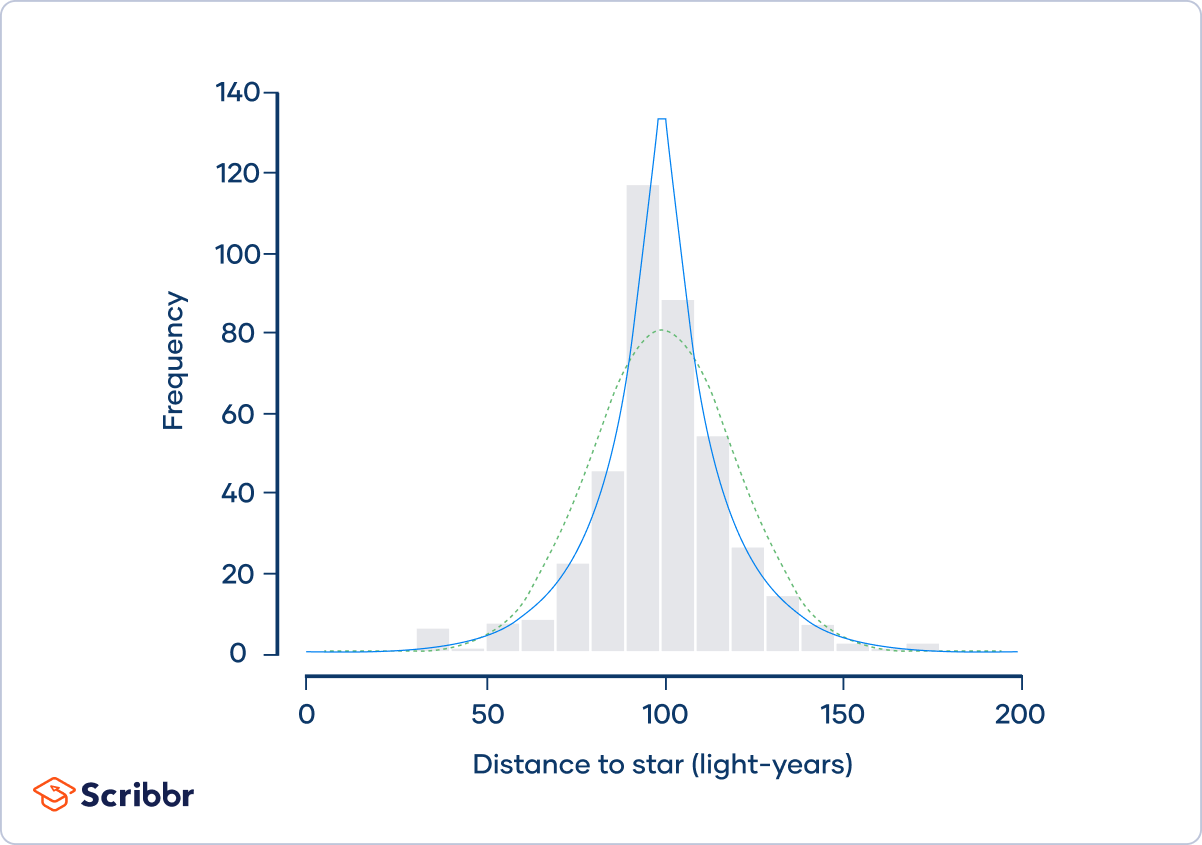
The frequency distribution (shown by the gray bars) doesn’t follow a normal distribution (shown by the dotted green curve). Instead, it approximately follows a Laplace distribution (shown by the blue curve). Laplace distributions are leptokurtic.
The astronomers calculate that the kurtosis of the sample is 6.54 and its excess kurtosis is 3.54. They conclude that the distribution is leptokurtic.
Leptokurtic distributions have frequent outliers. The distribution of the astronomers’ measurements has more outliers than you would expect if the distribution were normal, with several extreme observations that are less than 50 or more than 150 light-years.