How do you report research findings?
How do you report research findings?
Reporting research findings in a journal-style scientific paper is a matter of choosing the most relevant results organized in a way that sets up the ensuing discussion. This is a challenge with qualitative data that is unstructured in nature and vast in scope.
When dealing with large amounts of data, along with the word limits found in academic writing, there are a number of accepted practices that qualitative researchers employ to present their findings in a meaningful way.
Codes
Most qualitative studies rely on the coding of raw data. By annotating the data with short but descriptive keywords or key phrases, a researcher can provide structure to the data to identify key themes and patterns relevant to the research question at hand. Presenting these codes in your findings is thus a matter of describing those themes and detailing how the data highlights those themes.
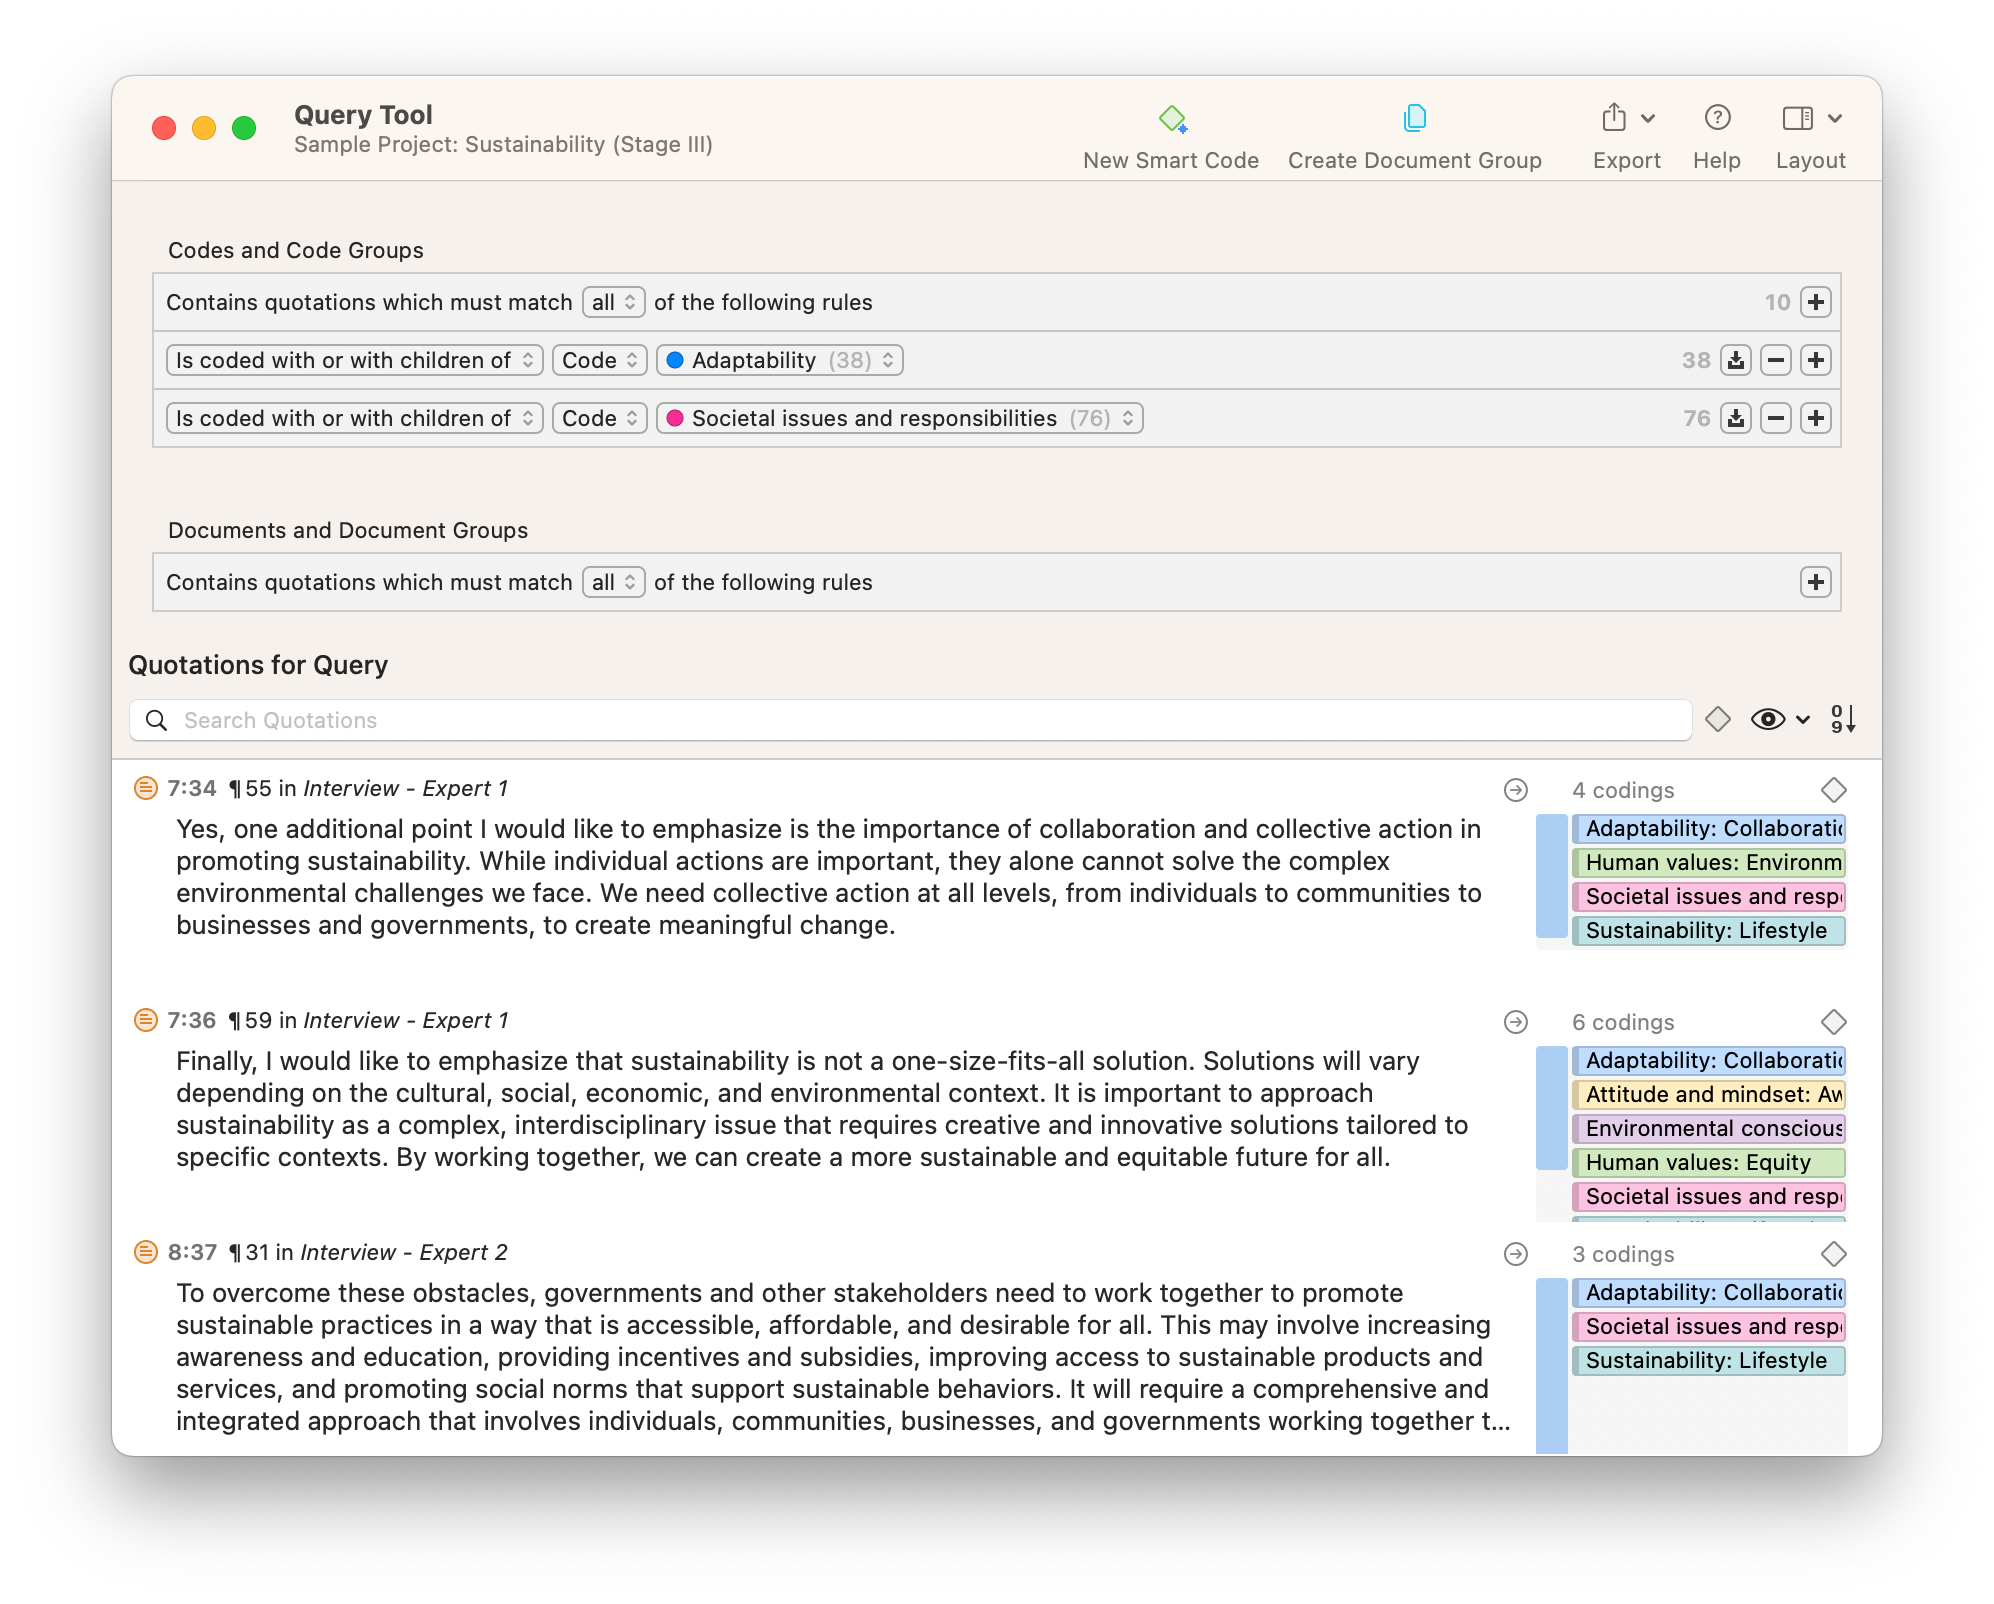
Depending on your research questions, detailing your codebook in a findings section can be a matter of, among other things, showing the most prevalent codes or the patterns of codes as applied to the data. After you have coded your data and grouped codes according to themes, you can conduct a thematic analysis to determine the most prevalent themes to describe the aspects of the concept or phenomenon you’re analyzing. Methods such as discourse analysis and narrative analysis also look at the combinations or sequences of codes to generate useful findings. In that case, qualitative data analysis software can help researchers determine the prevalence of such patterns, providing evidence for the assertions about the data collected.
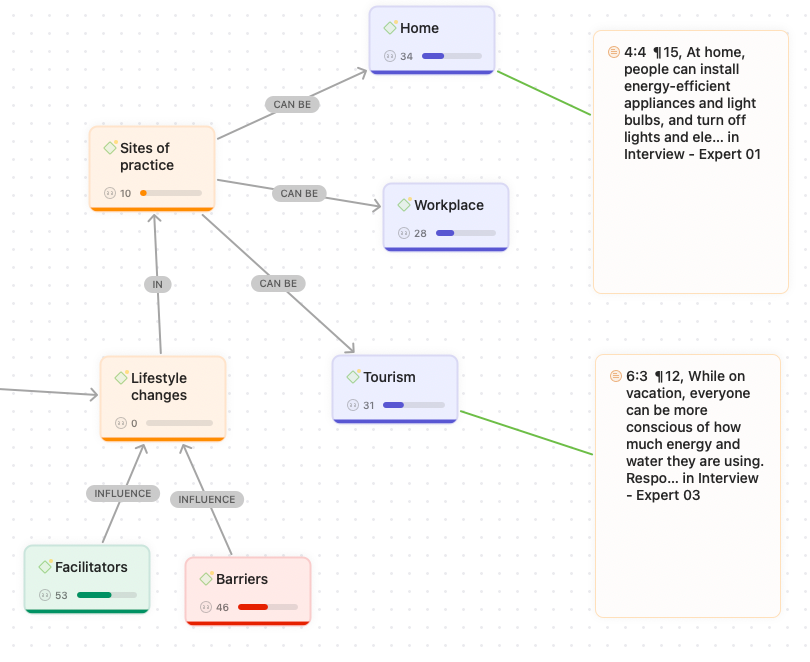
Researchers rely on tables and visualizations such as heat maps and Sankey diagrams to summarize an analysis of codes in a findings section. These figures are often followed by a systematic description of the themes and patterns in the data and what meanings they point out to help address the study’s research questions.
Excerpts
Data that comes directly from research participants can oftentimes be more powerful than the researcher’s descriptions of that data. If your research paper includes data generated from observations or interviews, then excerpts of that data can prove more persuasive as evidence given its authentic nature. For example, in a presentation of an interview study where researchers are given open access, nursing research and its insights can be made more credible when the perspectives and opinions of nursing practitioners are directly presented to the research audience.
Field notes can also be presented in findings as data that supports the critical insights of the study. Ethnographic research can produce useful observations documented at the time of data collection that can provide a basis for reflection in the findings section. In either case, excerpts of qualitative data in a findings section are often followed by the researcher’s descriptions of those excerpts and the rationale for why they serve as useful evidence supporting the study’s claims.
Narratives
Anthropological and sociological research often relies on the storytelling aspects of academic writing. It can be a significant challenge to capture an entire culture or social practice in a single segment of data or even a set of separate themes. In such cases, past-tense narratives can convey a holistic sense of the qualitative data to allow readers to immerse themselves in the culture that was observed.
The important point about writing narratives in a paper is that they should describe the salient parts of the data that address the research questions in addition to the context that helps the research audience understand the main findings. When constructing a narrative, it can become easy to lead the audience on a series of tangents that can prove confusing or unhelpful. You can craft a powerful narrative that contributes to scientific knowledge as long as it provides the necessary evidence for your claims while leaving out aspects that can turn out to be irrelevant to your research inquiry.
Figures and tables
To be clear, the findings section in a qualitative research paper cannot easily be reduced to a series of simple data visualizations alone, especially in research fields that depend on narratives to convey the important findings of a study. That said, overlooking the visual elements of a paper, particularly in social science research, can limit opportunities in highlighting evidentiary warrants supporting your claims.
Visualizations include networks, word clouds, heat maps, flowcharts, and Sankey diagrams, among others, all of which can restructure raw data in a form that your research audience can quickly and easily understand. Tables are also included in this discussion as they help to reduce large amounts of qualitative data into compact summaries. Even in social science disciplines that rely heavily on qualitative methods and naturalistic inquiry, statistical analyses and presentations of frequencies can serve a useful purpose in understanding patterns and tendencies. The common thread across all of these visualizations is that they complement the prose or written descriptions of your key findings.