Trade-off between Type I and Type II errors
Trade-off between Type I and Type II errors
The Type I and Type II error rates influence each other. That’s because the significance level (the Type I error rate) affects statistical power, which is inversely related to the Type II error rate.
This means there’s an important tradeoff between Type I and Type II errors:
- Setting a lower significance level decreases a Type I error risk, but increases a Type II error risk.
- Increasing the power of a test decreases a Type II error risk, but increases a Type I error risk.
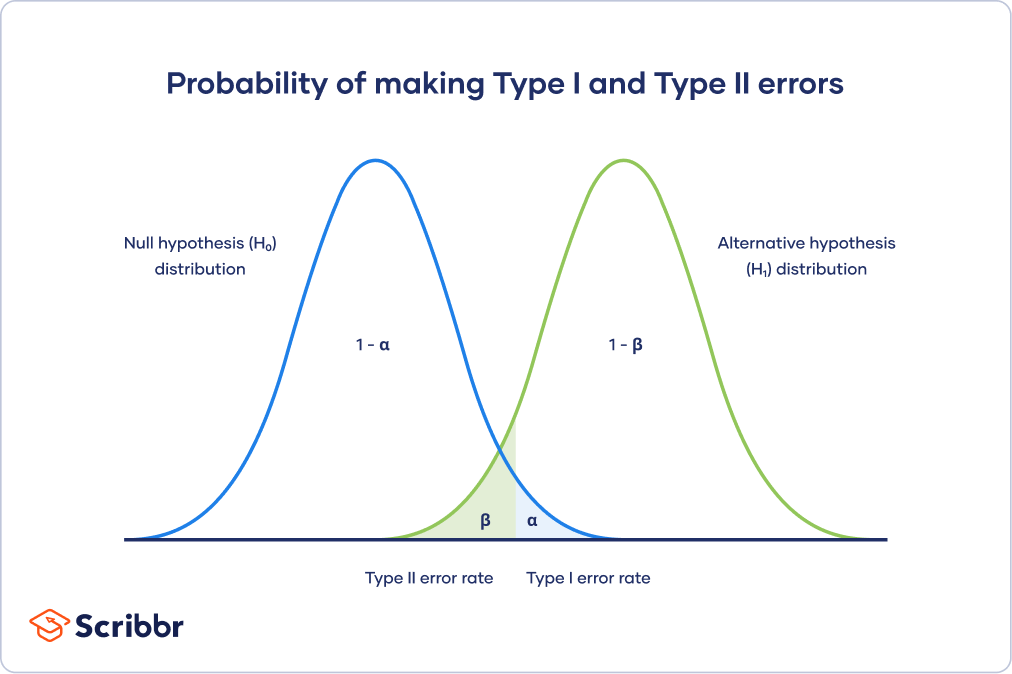
This trade-off is visualized in the graph below. It shows two curves:
- The null hypothesis distribution shows all possible results you’d obtain if the null hypothesis is true. The correct conclusion for any point on this distribution means not rejecting the null hypothesis.
- The alternative hypothesis distribution shows all possible results you’d obtain if the alternative hypothesis is true. The correct conclusion for any point on this distribution means rejecting the null hypothesis.
Type I and Type II errors occur where these two distributions overlap. The blue shaded area represents alpha, the Type I error rate, and the green shaded area represents beta, the Type II error rate.
By setting the Type I error rate, you indirectly influence the size of the Type II error rate as well.
It’s important to strike a balance between the risks of making Type I and Type II errors. Reducing the alpha always comes at the cost of increasing beta, and vice versa.