Error in statistical decision-making
Error in statistical decision-making
Using hypothesis testing, you can make decisions about whether your data support or refute your research predictions with null and alternative hypotheses.
Hypothesis testing starts with the assumption of no difference between groups or no relationship between variables in the population—this is the null hypothesis. It’s always paired with an alternative hypothesis, which is your research prediction of an actual difference between groups or a true relationship between variables.
In this case:
- The null hypothesis (H0) is that the new drug has no effect on symptoms of the disease.
- The alternative hypothesis (H1) is that the drug is effective for alleviating symptoms of the disease.
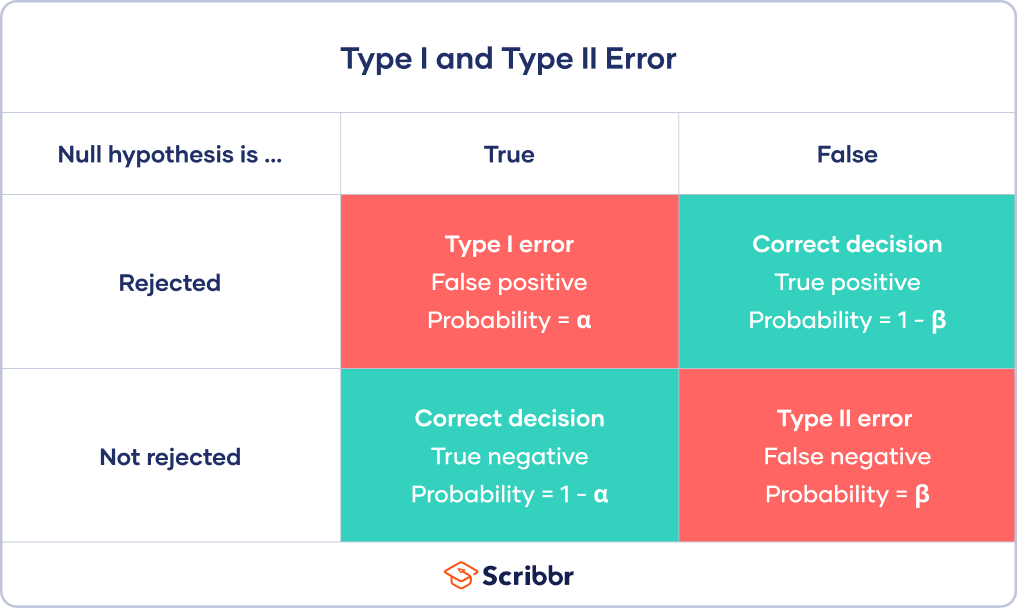
Then, you decide whether the null hypothesis can be rejected based on your data and the results of a statistical test. Since these decisions are based on probabilities, there is always a risk of making the wrong conclusion.
- If your results show statistical significance, that means they are very unlikely to occur if the null hypothesis is true. In this case, you would reject your null hypothesis. But sometimes, this may actually be a Type I error.
- If your findings do not show statistical significance, they have a high chance of occurring if the null hypothesis is true. Therefore, you fail to reject your null hypothesis. But sometimes, this may be a Type II error.
A Type II error happens when you get false negative results: you conclude that the drug intervention didn’t improve symptoms when it actually did. Your study may have missed key indicators of improvements or attributed any improvements to other factors instead.
Prevent plagiarism. Run a free check.
Type I error
A Type I error means rejecting the null hypothesis when it’s actually true. It means concluding that results are statistically significant when, in reality, they came about purely by chance or because of unrelated factors.
The risk of committing this error is the significance level (alpha or α) you choose. That’s a value that you set at the beginning of your study to assess the statistical probability of obtaining your results (p value).
The significance level is usually set at 0.05 or 5%. This means that your results only have a 5% chance of occurring, or less, if the null hypothesis is actually true.
If the p value of your test is lower than the significance level, it means your results are statistically significant and consistent with the alternative hypothesis. If your p value is higher than the significance level, then your results are considered statistically non-significant.
However, the p value means that there is a 3.5% chance of your results occurring if the null hypothesis is true. Therefore, there is still a risk of making a Type I error.
To reduce the Type I error probability, you can simply set a lower significance level.
Type I error rate
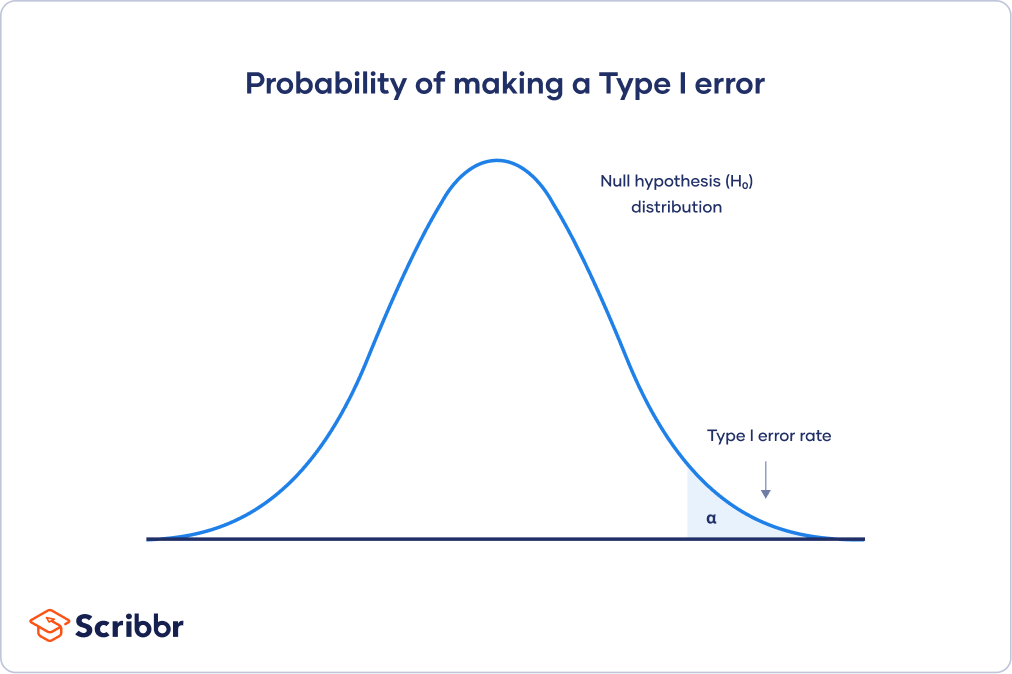
The null hypothesis distribution curve below shows the probabilities of obtaining all possible results if the study were repeated with new samples and the null hypothesis were true in the population.
At the tail end, the shaded area represents alpha. It’s also called a critical region in statistics.
If your results fall in the critical region of this curve, they are considered statistically significant and the null hypothesis is rejected. However, this is a false positive conclusion, because the null hypothesis is actually true in this case!
Type II error
A Type II error means not rejecting the null hypothesis when it’s actually false. This is not quite the same as “accepting” the null hypothesis, because hypothesis testing can only tell you whether to reject the null hypothesis.
Instead, a Type II error means failing to conclude there was an effect when there actually was. In reality, your study may not have had enough statistical power to detect an effect of a certain size.
Power is the extent to which a test can correctly detect a real effect when there is one. A power level of 80% or higher is usually considered acceptable.
The risk of a Type II error is inversely related to the statistical power of a study. The higher the statistical power, the lower the probability of making a Type II error.
However, a Type II may occur if an effect that’s smaller than this size. A smaller effect size is unlikely to be detected in your study due to inadequate statistical power.
Statistical power is determined by:
- Size of the effect: Larger effects are more easily detected.
- Measurement error: Systematic and random errors in recorded data reduce power.
- Sample size: Larger samples reduce sampling error and increase power.
- Significance level: Increasing the significance level increases power.
To (indirectly) reduce the risk of a Type II error, you can increase the sample size or the significance level.
Type II error rate
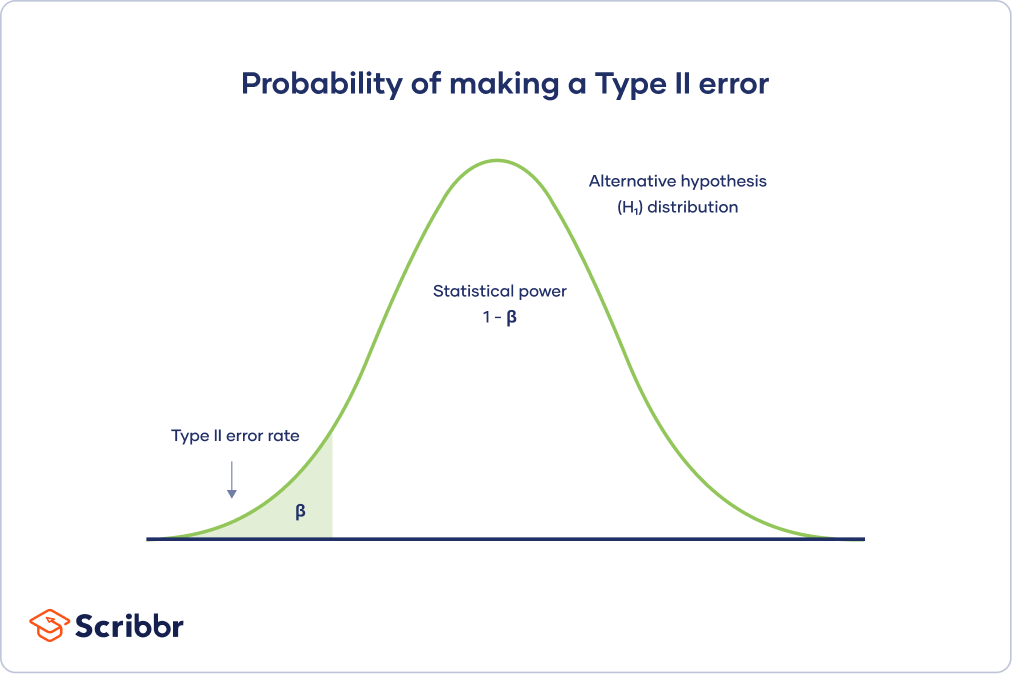
The alternative hypothesis distribution curve below shows the probabilities of obtaining all possible results if the study were repeated with new samples and the alternative hypothesis were true in the population.
The Type II error rate is beta (β), represented by the shaded area on the left side. The remaining area under the curve represents statistical power, which is 1 – β.
Increasing the statistical power of your test directly decreases the risk of making a Type II error.
Trade-off between Type I and Type II errors
The Type I and Type II error rates influence each other. That’s because the significance level (the Type I error rate) affects statistical power, which is inversely related to the Type II error rate.
This means there’s an important tradeoff between Type I and Type II errors:
- Setting a lower significance level decreases a Type I error risk, but increases a Type II error risk.